Plot This
This post originally appeared on the Software Carpentry website.
The most useful little guide to visualization I've ever found is the decision tree created by Andrew Abela, which you can find here. Do you want to show a comparison, a distribution, a relationship, or a composition? If it's a comparison, is it among items or over time? Each choice leads to a different kind of plot, and while you may not agree with all the choices, it makes the reasoning behind them concrete.
One day, I hope someone will turn that chart into a half-day lesson on visualization for Software Carpentry. Before then, though, I have a little visualization challenge that I think some of you might enjoy. This small data set shows population, number of workshop attendees, and number of instructors by country:
Country,       Population,  Attendees,  Instructors
Australia,       23737000,        592,           11
Brazil,         203850000,        116,            1
Canada,          35675000,       1215,           46
China,         1368090000,         24,            1
Cyprus,            858000,         25,            0
Denmark,          5655000,         20,            1
France,          66092000,         72,            4
Germany,         80767000,        183,            6
Ghana,           27043000,         24,            0
India,         1266580000,          0,            1
Ireland,          4609000,          0,            1
Israel,           8296000,          0,            1
Italy,           60782000,         81,            1
Japan,          127020000,          0,            1
Jordan,           6688000,         34,            0
Lebanon,          4104000,         25,            0
Netherlands,     16888000,         39,            0
New Zealand,      4560000,         19,            1
Norway,           5156000,         90,            2
Poland,          38496000,         60,            5
Saudi Arabia,    31521000,         20,            0
Singapore,        5469000,          0,            1
South Africa,    54002000,         90,            2
Spain,           46464000,          0,            2
Sweden,           9743000,         54,            3
Switzerland,      8211000,         63,            0
Thailand,        64871000,          0,            1
United Kingdom,  64105000,       1231,           48
United States,  320354000,       5253,          166
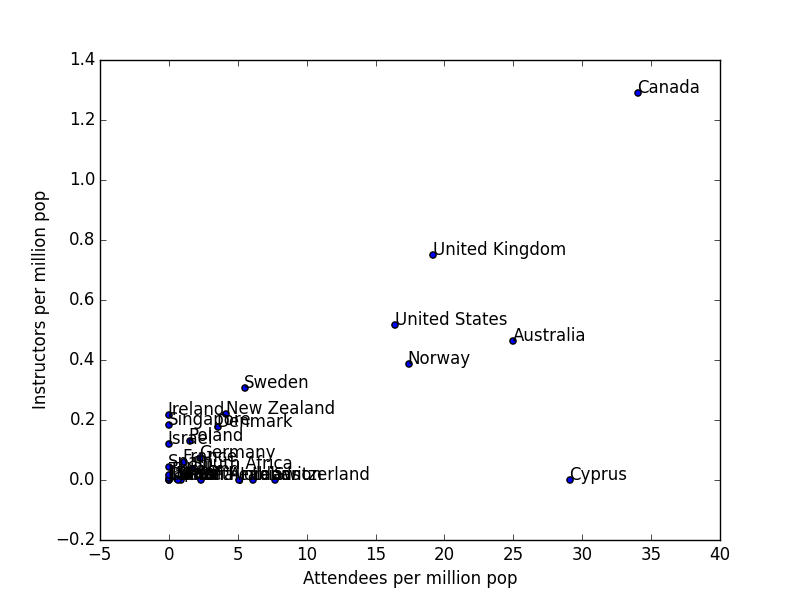
I'd like a scatter plot comparing workshop attendees per capita to instructors per capita. This little Python program does that:
import sys
import csv
import numpy as np
from matplotlib import pyplot as plt

countries = []
populations = []
attendees = []
instructors = []
with open(sys.argv[1], 'r') as raw:
    cooked = csv.reader(raw)
    for (c, p, a, i) in cooked:
        countries.append(c)
        populations.append(float(p))
        attendees.append(float(a))
        instructors.append(float(i))

populations = np.array(populations) / 1e6
attendees = np.array(attendees) / populations
instructors = np.array(instructors) / populations

plt.scatter(attendees, instructors)
plt.xlabel('Attendees per million pop')
plt.ylabel('Instructors per million pop')

for (label, x, y) in zip(countries, attendees, instructors):
    plt.annotate(label, xy = (x, y))

plt.show()
(You can download the data and program here and here, and yes, the CSV has all those extra spaces taken out.) The plot produced by this program is:

It's not particularly useful (which is Canadian for "it's awful"): labels overlap, values crowd near the origin, and so on. My challenge to readers is to create something better. More specifically, add a comment to this post with your code (in any language) and a link to the picture it produces, and explain briefly why you think it's better. And while you're thinking about how to do that, have a look at Ned Gulley's In Praise of Tweaking — if there's a way to do for visualization what his programming contest does for performance, I'd like to give it a try.
Dialogue & Discussion
Comments must follow our Code of Conduct.
