Teaching reproducible science with R to a wide range of experience levels
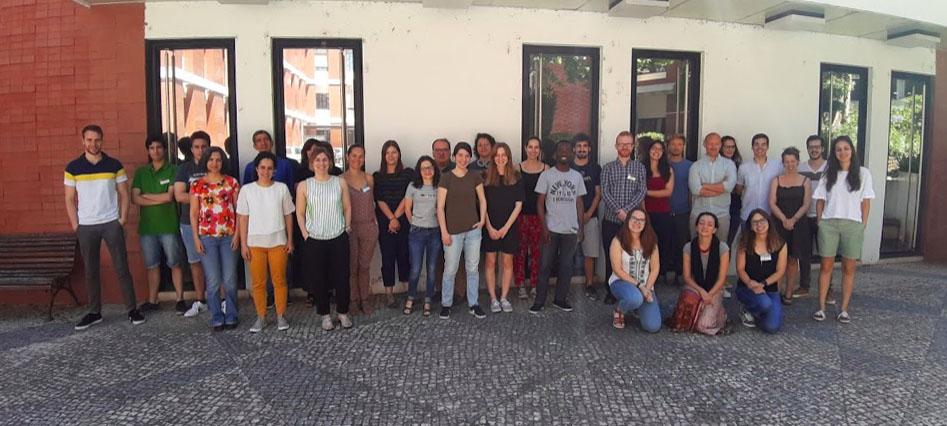
 Carpentries Workshop attendees, Instituto Gulbenkian de Ciência, Portugal in May 2019. Photo credit: IGC
My name is Phil Reed (Twitter and GitHub) and I am a relative new-comer to The Carpentries, having qualified as an instructor last autumn. I co-led a Library Carpentry event at The University of Manchester Library where I work as a Data Specialist. In May 2019, I travelled to the Instituto Gulbenkian de Ciência (IGC) in Oeiras, Portugal to co-lead my first Software Carpentry workshop. The title of this two-day session was “R for Reproducible Scientific Analysis”, covering R and some version control with Git, for bioinformatics researchers and students. Below is a brief evaluation from me, the other co-lead Eric Persson and the head of training at IGC, Pedro Fernandes.
The learners were very welcoming and keen to participate. They arrived with a wider range of programming comfort levels than Eric and I expected, perhaps exhibiting a bimodal distribution of people who found our plan too fast or too slow. I’m used to teaching rooms where people are not all at the same stage, but this group was noticeably wide, and that accumulated over the first day.
In response to ongoing feedback, we adjusted the plan on the morning of the second day, removing some of the lessons that are fairly repetitive (different ways to achieve the same results, people often do not need to know so many ways to subset data frames). We found that there were many peripheral topics (such as matrices) that, on hindsight, we would not deliver effectively in the available time. So we introduced more recap exercises, taken from the alpha Data Carpentry R Genomics lessons, using a different dataset to practice loading CSV files, subsetting and plotting charts. This approach helped people to catch up and reinforce what they had just learned. At the same time, we gave some of the advanced learners in the room more challenges or lessons to mostly read on their own, or more kinds of charts to produce. One learner found animated chart functions so we shared them with the other learners to try. We could have benefitted from having more challenges prepared ahead of time.
On the whole we were able to meet all our objectives, the students went away able to conduct more efficient, accurate, reproducible and reusable scientific analysis using R, and they enjoyed learning. I found it hard work but rewarding and satisfying.