
Tips and Tricks for Teaching R
Following a few Data Carpentry workshops, we (a.k.a. Bianca and Katrin) shared some of the strategies we employ to enhance participants’ R learning experience in a Community Discussion with other Carpentries Instructors from Africa. In this post, we will expound on some of these strategies and welcome you to try them in the workshops you facilitate, and share your outcomes with the broader Carpentries community.
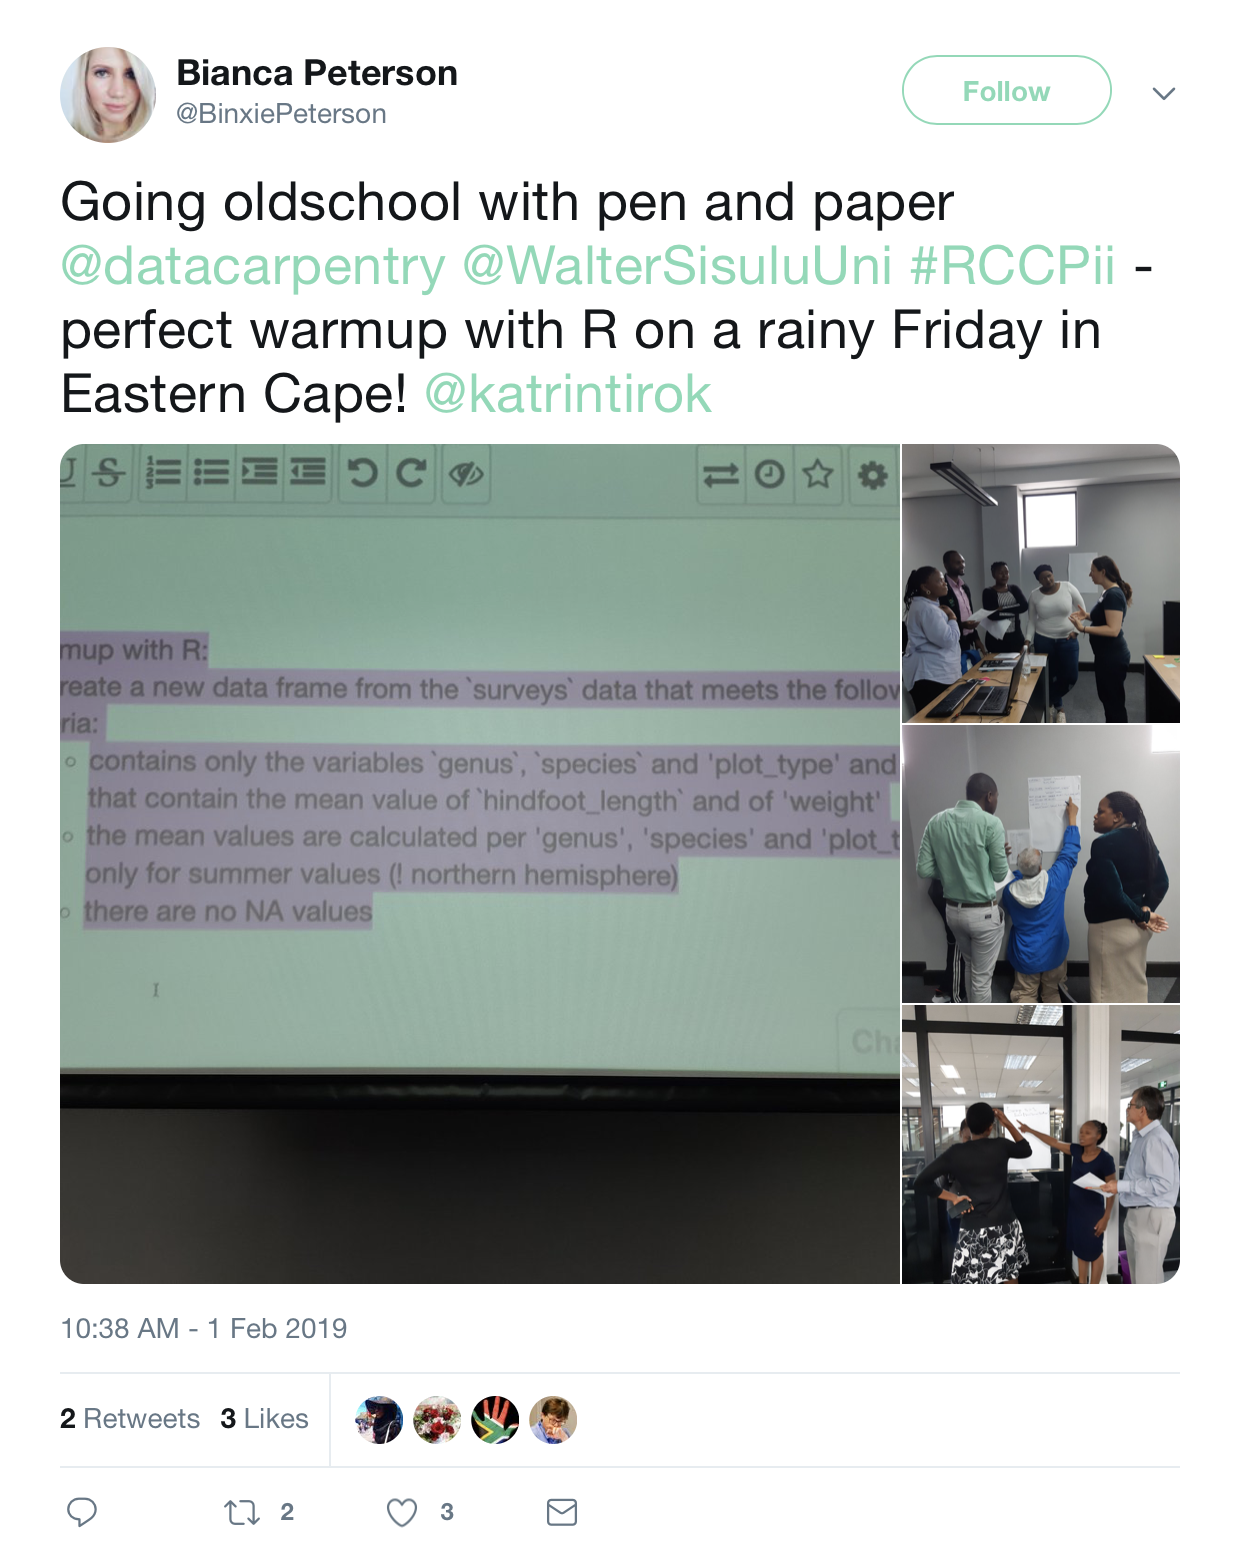
Pen-on-paper exercise
In the R episodes on Data Manipulation and on Visualisation, code and challenges become quite complex and may contain new concepts of coding as well as of data analysis for novices. Individual code blocks can easily run over several lines when using pipes (%>%) or when building plots with ggplot, thus increasing cognitive load for learners. To enhance understanding of the concepts behind the R commands and also to give participants a break from sitting in front of the computer, we included group exercises with pen and paper. We divided participants into groups of four to five and gave each group a blank sheet of paper (it works particularly nice with big sheets stuck to a wall so the groups can stand around it). We then wrote a challenge on the Workshop Etherpad/whiteboard and asked the groups to discuss and write down the steps (not necessarily the commands) they would need to subset their data accordingly.
Example challenge from the Ecology lesson:
Create a new data frame from the surveys data that meets the following criteria: contains only the species_id column and a new column called hindfoot_half containing values that are half the hindfoot_length values. In this hindfoot_half column, there are no NAs and all values are less than 30.
It might sound easy at first, but learners had to think carefully about which steps (commands) should come first. In this example, the steps would be:
- take the dataframe,
- create a new column to calculate half the hindfoot length,
- then keep only values less than 30 and remove NA values, and
- finally only keep the two columns specified, that is, species_id and hindfoot_half.
Some of the participants placed the select() step first, because it was easier to remember. However, you can’t “keep” a column if you have not “created” it first. Participants really enjoyed this “pen-on-paper” exercise and said it helped them to think about how they needed to structure commands to obtain the desired subset of data. Credit goes to Katrin for this suggestion/idea at a previous Data Carpentry workshop at Walter Sisulu University.
Challenges-handout
There was some discussion previously in the community on how to improve delivery of challenges in the Python and R lessons. Quite often, we ‘just’ copy the text of the challenge into the Etherpad and participants then need to switch between the Etherpad and their code editor to work through the challenge. Copying to the Etherpad often also breaks the formatting of the challenge and can be disruptive.
In a post on The Carpentries blog, Sarah Brown described how to make use of the %load magic command in Jupyter Notebooks with Python and since we used it in the Data Carpentry workshop during CarpentryConnect Johannesburg last year, we were looking for something similar in R. We made use of a pre-written commented script for the challenges, which is a cleaner, shorter version of the code-handout. The questions for the challenges are placed as comments, and spaces are provided where participants can type their code. Participants mentioned that it worked well, because they didn’t have to switch between the Etherpad and RStudio, or look up at the screen to read the questions.
Below is a snippet of the R challenges handout:
## Challenge 8 ##

# 8.1. Instead of creating a data frame with read.csv(), create your own using data.frame()
# The following code has a few mistakes. Fix the code.

animal_data <- data.frame(animal = c(dog, cat, sea cucumber, sea urchin),
                          feel = c("furry", "squishy", "spiny"),
                          weight = c(45, 8 1.1, 0.8))

# 8.2. Can you predict the class for each of the columns in the following example?
     # Check your guesses using `str(country_climate)`:

country_climate <- data.frame(country=c("Canada", "Panama", "South Africa", "Australia"),
                              climate=c("cold", "hot", "temperate", "hot/temperate"),
                              temperature=c(10, 30, 18, "15"),
                              northern_hemisphere=c(TRUE, TRUE, FALSE, "FALSE"),
                              has_kangaroo=c(FALSE, FALSE, FALSE, 1))

#      8.2.1. Are they what you expected? Why? why not?
#      8.2.2. What would have been different if we had added `stringsAsFactors = FALSE`
#        to this call?
#      8.2.3. What would you need to change to ensure that each column had the
#        accurate data type?


# 8.3. How can the code be improved?


## YOUR CODE HERE ##


######################################################

## Challenge 9 ##

# 9.1. Using pipes, subset the survey data to include individuals collected before
# 1995 and retain only columns "year", "sex", and "weight"


## YOUR CODE HERE ##
Feel free to make use of this challenges handout by pasting this link (https://tinyurl.com/y5zzo268) in the workshop Etherpad - once participants click on this link, it will request permission to download the challenges.R script. Since the original code-handout is generated automatically, it would be possible to also automatically generate a handout only containing the challenges nicely formatted. This will give instructors an opportunity to choose what they want to use. It is also possible to use the code/challenges-handout as the basis for your own handout placed in a separate GitHub repository or fork, whose download link can be provided to participants. This way, last minute changes, e.g. extra challenges, can be pushed to the repository without the link changing (cf. Sarah Brown).
One-page summary of R commands
At a previous Data Carpentry workshop at Walter Sisulu University the participants mentioned (on sticky note feedback) that a one-page summary of R commands would be really helpful, since learning all these new commands can be overwhelming. Bianca agreed and decided to make this one-page summaRy. We suggest printing enough copies before the workshop and handing them out to the learners, so they can have them next to their computers as a ‘cheat sheet’.
What tips and tricks do you employ in teaching Carpentries workshops? Share with the rest of The Carpentries community by publishing a post about them on this blog!
Dialogue & Discussion
Comments must follow our Code of Conduct.