Evidence of Carpentries' Impact on Learners
Many community members who want to justify involvement with The Carpentries would like evidence that our workshops have an impact. We’ve had some exciting results from our surveys and want to make you aware of the impact our workshops have on learners.
Kari Jordan recently presented the paper, Short-format workshops build skills and confidence for researchers to work with data, at ASEE’s Annual Conference. Several community members collaborated on this work, and it offers a comprehensive look at data science workforce needs and training, Carpentries’ teaching practices, and the long-term impact (meaning six-months to a year after) our workshops have on learners’ skills and confidence.
A few highlights from this paper include:
- 66.2% of respondents use programming languages and/or the command line to automate repetitive tasks.
- 49.3% of respondents have improved their data management and project organisation.
- 46.1% of respondents use version control to manage code.
Additionally, we asked how the tools covered in workshops help respondents in their research or work, six-months to a year after completing a workshop. Respondents were asked to check all that apply. The table below provides a synopsis.
| How Tools Have Helped Research/Work | n | % |
|---|---|---|
| They are improving my overall efficiency. | 254 | 59.5 |
| They are improving my ability to analyse data. | 228 | 53.4 |
| They are improving my ability to manage data. | 214 | 50.1 |
| I am not using the tools I learned. | 65 | 15.2 |
| The tools I learned have not helped me with my work. | 30 | 7.0 |
We realise there some learners have not used the tools they learned. However, it’s compelling to see that more than half of respondents have improved their efficiency and ability to manage and analyse data. We recently collected data for the fourth round of our long-term impact survey. Check out the comprehensive report, and feel free to contribute analysis through an issue or pull request to add to and/or improve the code from this report.
Survey analysis
In addition to the ASEE long-term impact paper and report, we recently published an Analysis of Software and Data Carpentry’s Pre- and Post-Workshop Surveys. We’re particularly proud of what respondents had to say about their workshop environment and instructional team:
- 79% of Data Carpentry respondents either agree or strongly agree that they felt comfortable learning in their workshop environment.
- 87.1% of Software Carpentry respondents agreed or strongly agreed the workshop atmosphere was welcoming.
- 96.2% of Data Carpentry respondents said they felt comfortable interacting with the instructors.
- 96% of Software Carpentry respondents felt their instructors and helpers were enthusiastic and considerate.
- 65.2% of Data Carpentry respondents either agree or strongly agree that they’re able to immediately apply what they learned in the workshop.
One compelling argument you can make when telling friends/colleagues about Carpentries workshops is the impact we have on learners’ skills and confidence. For example, in Data Carpentry’s surveys, we ask respondents to rate their level of agreement with the following statements related to Data Carpentry’s workshop goals and learning objectives.
- Write Program: I can write a small program/script/macro to solve a problem in my own work.
- Search Online: I know how to search for answers to my technical questions online.
- Raw Data: Having access to the original, raw data is important to be able to repeat an analysis.
- Programming Efficient: Using a programming language (like R or Python) can make me more efficient at working with data.
- Programming Confident: I am confident in my ability to make use of programming software to work with data.
- Overcome Problem: While working on a programming project, if I get stuck, I can find ways of overcoming the problem.
- Analyses Easier: Using a programming language (like R or Python) can make my analyses easier to reproduce.
The scoring for the above factors ranges from strongly disagree (1) to strongly agree (5). The figure below provides a visual representation of their responses, comparing them before the workshop and after the workshop.
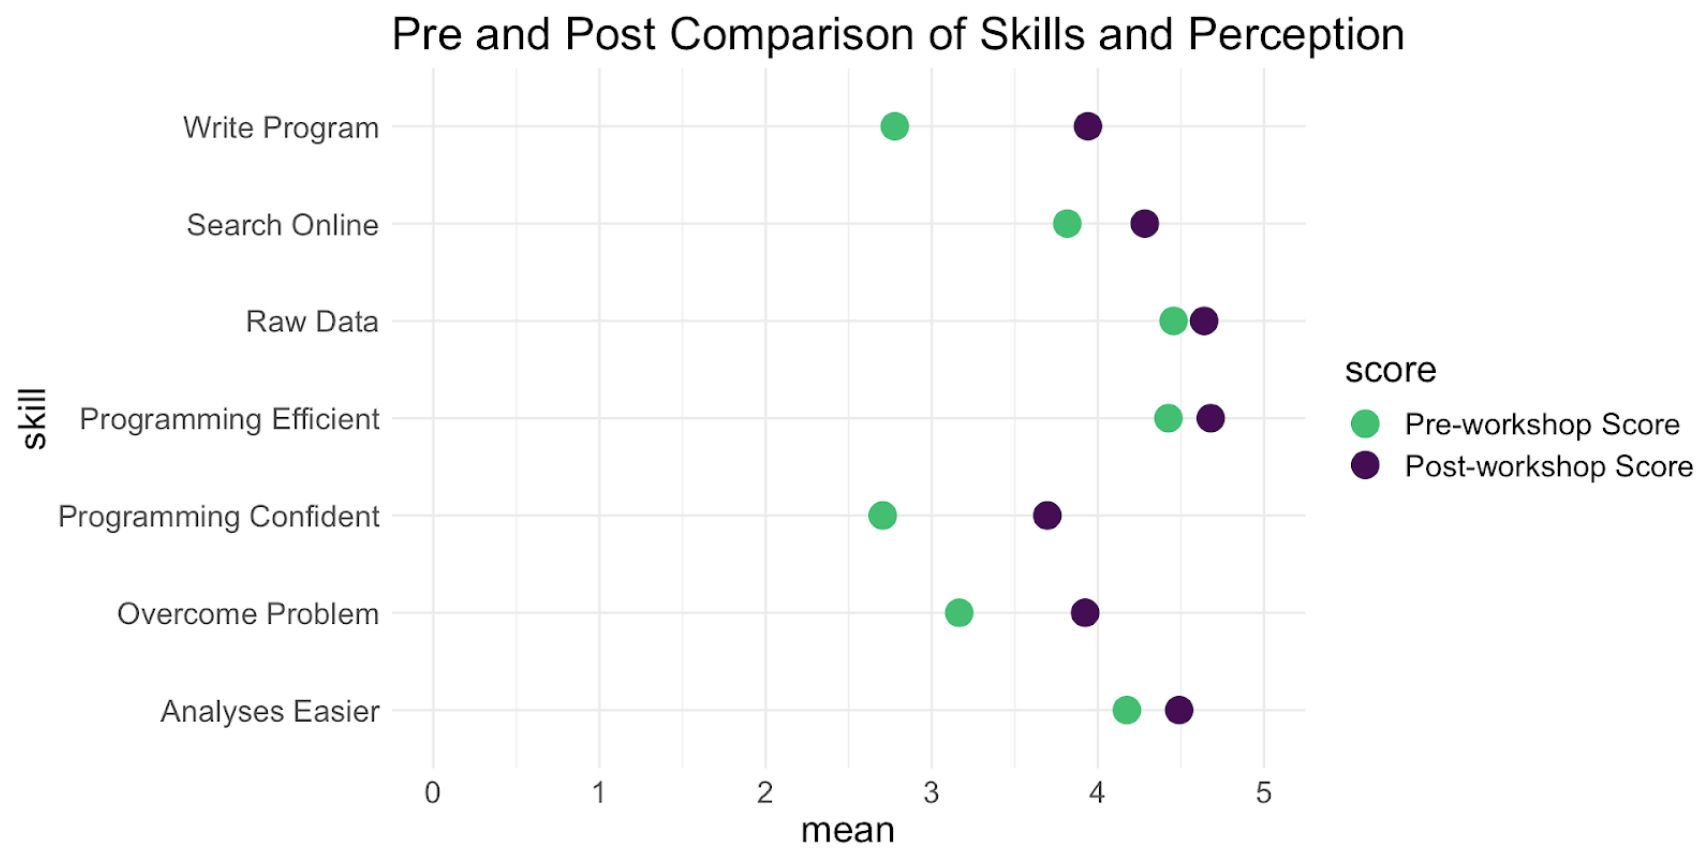
The comparison above is paired, meaning, we are comparing those who provided us with a unique identifier and who completed both the pre- and post-workshop survey. The data shows, for multiple factors, a full point increase in mean score. We are significantly impacting respondents’ confidence in their ability to work with programming software, to write programs to solve problems, and to overcome problems if they get stuck.
We invite you to read the report in its entirety, and download the data and source code to run your own analysis. Share with us what’s striking about this data on Twitter using the hashtag #carpentriesassessment.
Rationale for data collection
Why do we take the time to collect this data and share it with our community? As we continue to grow as instructors and curriculum developers, this data helps us to understand what challenges we may face, and how we can strive for continuous improvement. These results also help drive improvements to our lesson materials.
YOU are the proof that we’re making an impact. We challenge you to promote our short and long-term surveys, and to participate in instructor discussion sessions.