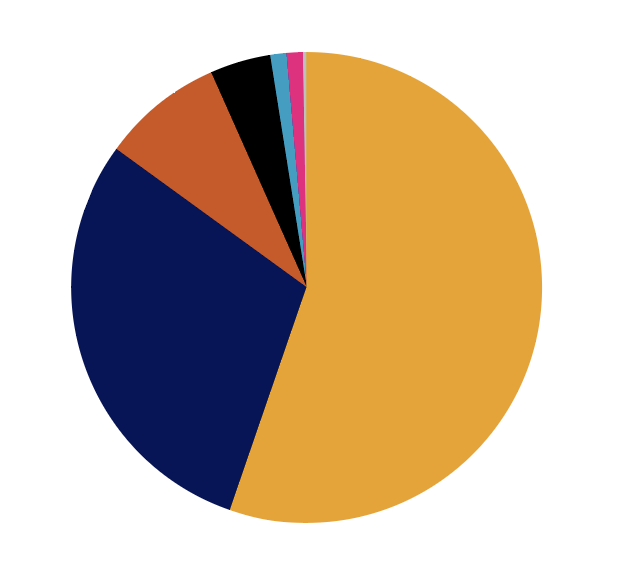
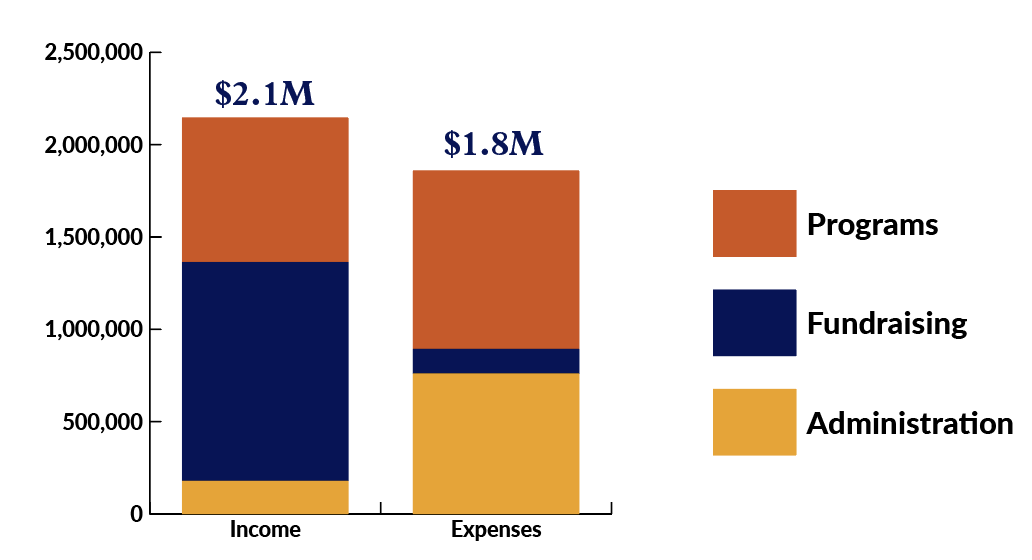
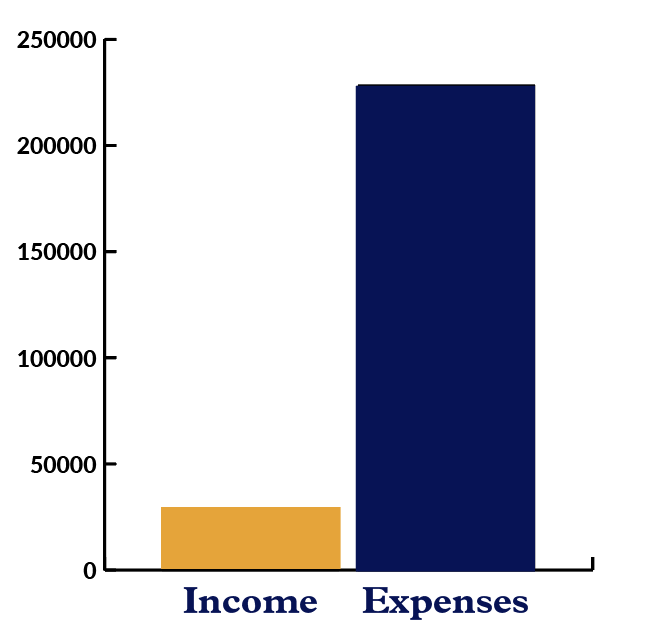
Income: $2,146,526
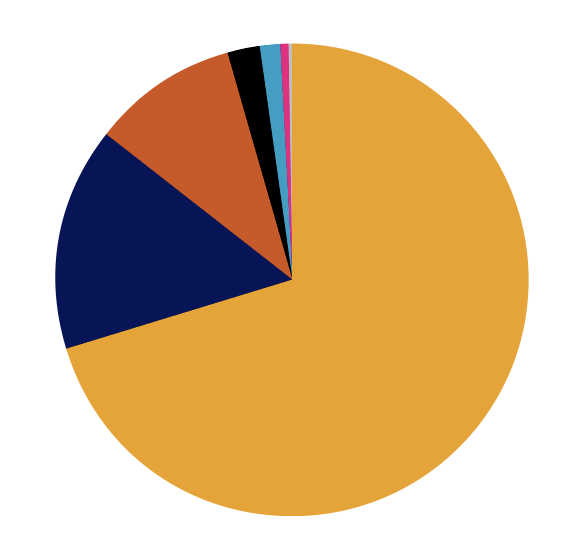
Expenses: $1,859,716
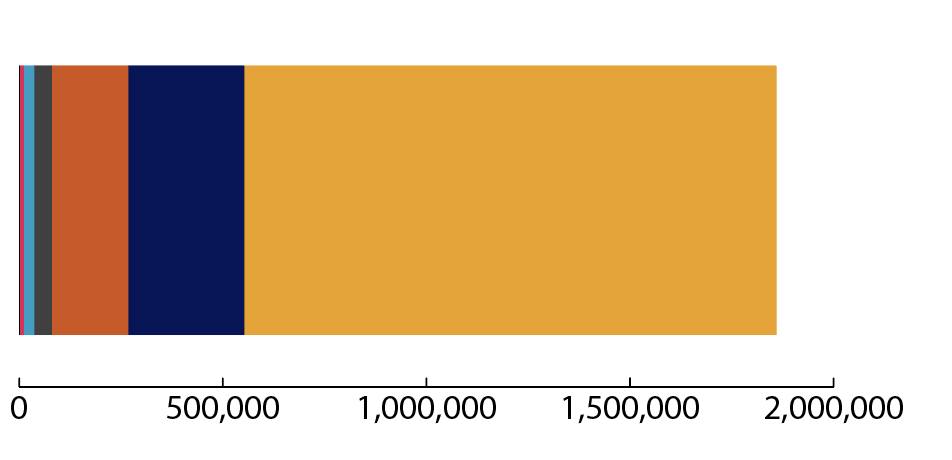
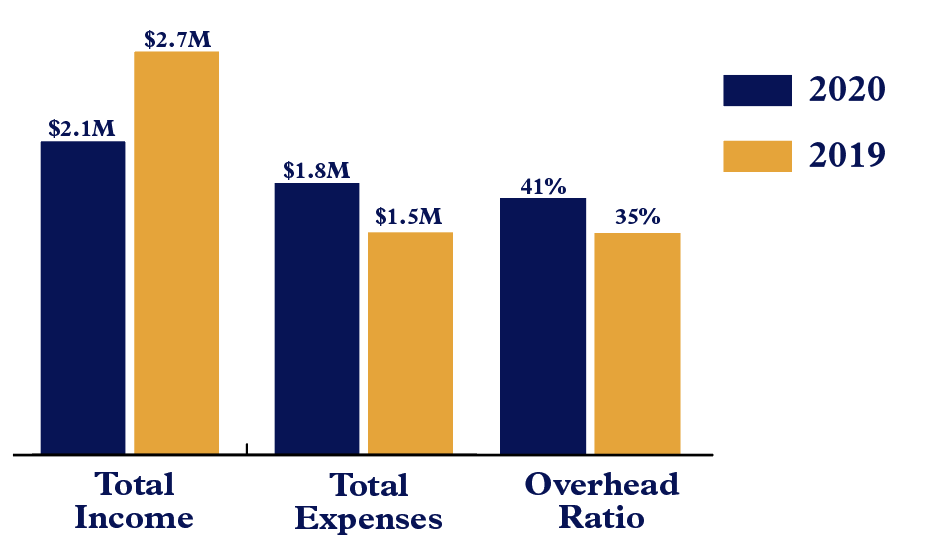
The Carpentries generated $2.1M in revenue in 2020 to support our community and mission. 35% of our revenue was generated through programs, providing $783,164 in unrestricted funds. Our fundraising efforts, including grants, sponsorships and donations, generated 57% of our total income. These funds support our infrastructure, community and Core Team operations. The figure below provides a synopsis of how revenue is used: 52% supports programs, 41% supports administration, and 7% supports fundraising efforts.
| Income | Expenses | |
|---|---|---|
| Programs | $783,164 | $759,969 |
| Fundraising | $1,185,045 | $133,096 |
| Administration | $178,316 | $966,651 |
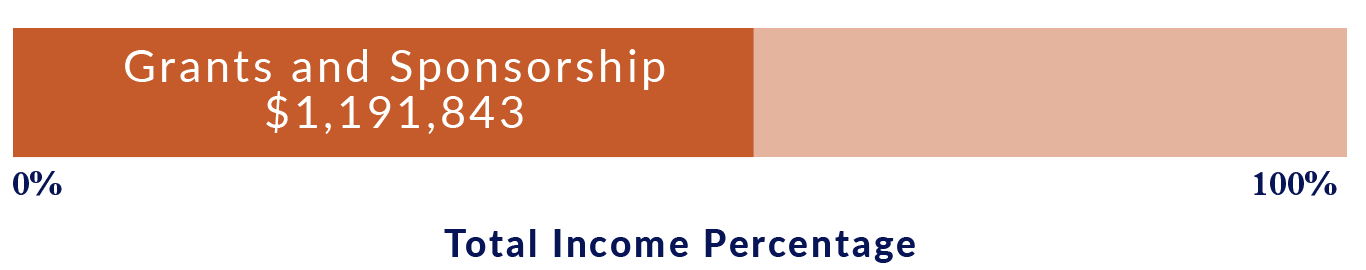
56% of The Carpentries income in 2020 was earned through grants and sponsorships. The Carpentries has been able to improve its programmatic operations thanks to the generous support of the Gordon and Betty Moore Foundation, Chan Zuckerberg Initiative, Alfred P. Sloan Foundation, Mozilla Foundation, and the California Digital Library through the Institute of Museum and Library Services.
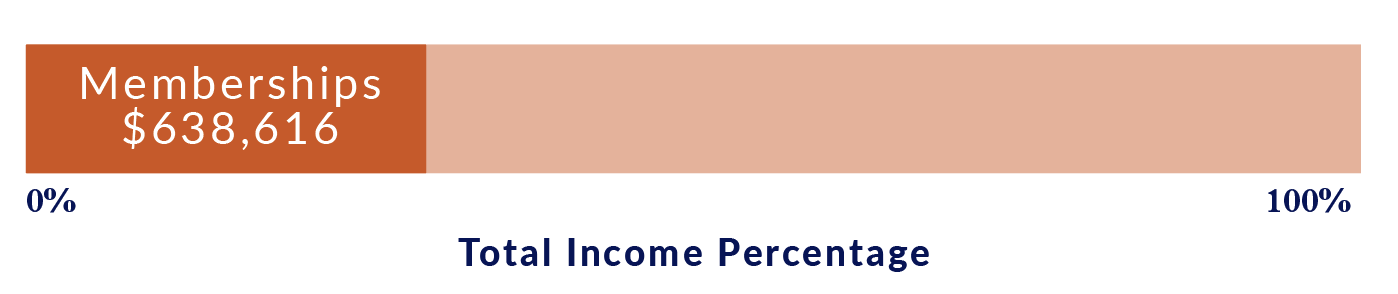
Our Membership program is a major source of revenue. In 2020, memberships accounted for nearly 30% of our income. To continue bolstering this income stream, and to help further ensure our commitment to The Carpentries’ member organisations, The Carpentries hired and onboarded a Director of Partnerships in March 2021.
Income: $2,146,526
Our operational expenses grew by 22% from 2019 to 2020. This increase in expenses is attributed to hiring 4 new Core Team members to support Instructor Training, Curriculum, Lesson Template Infrastructure and Communications. Additionally, our shift to virtual instruction accounted for increases in our infrastructure and operating costs.
| Category | Expenses |
|---|---|
| Program Supplies & Communications | $1,275 |
| Meetings & Travel | $9.430 |
| Legal & Professional | $25,887 |
| Software & Subscription Services | $42,714 |
| Fiscal Sponsorship | $188,193 |
| Consultants | $284,879 |
| Team | $1,307,339 |
| Total | $1,859,717 |
The metrics below are a few performance indicators that highlight information important to the financial sustainability of The Carpentries.
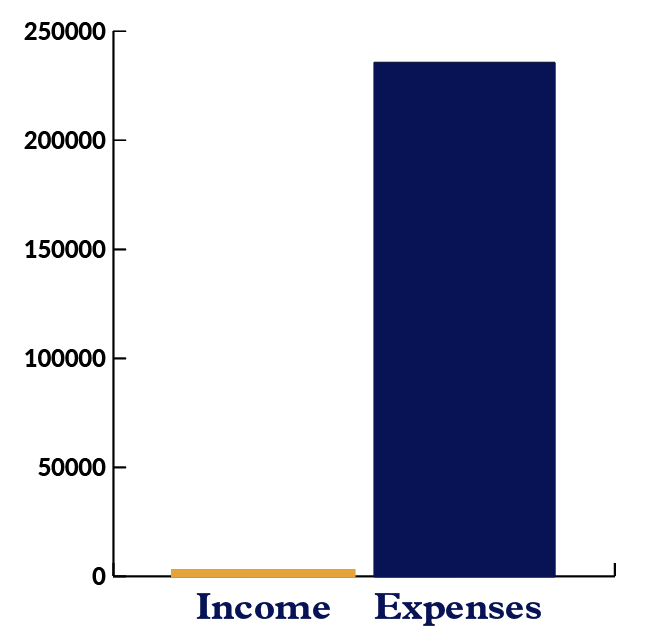
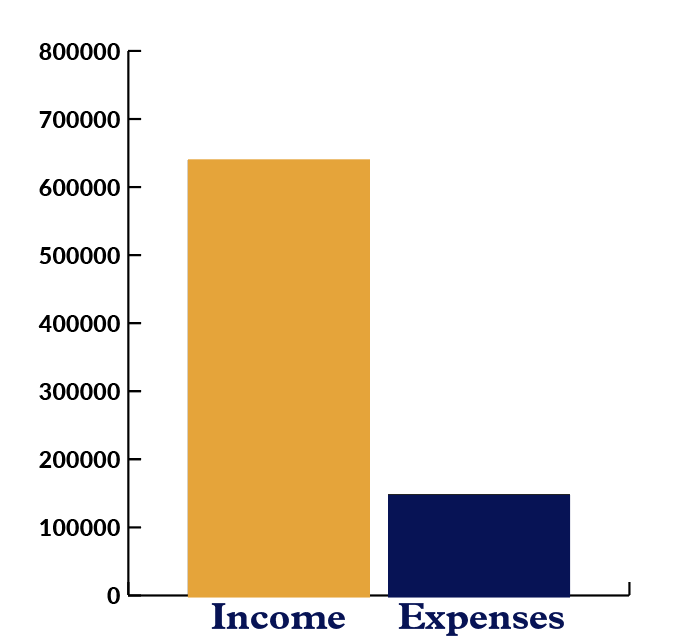
Programs are our leading source of unrestricted funds. While grant income is considered restricted and can only be used for the purposes outlined in the grant, unrestricted funds may be used for any purpose that supports our mission. This indicator measures our ability to sustain our current operations, which includes our work toward grant deliverables. The measure shows that we are currently relying on grant funds to support growth and to expand our reach.
In 2020, our operating reliance was 42% compared to 73% in 2019 and 64% in 2018.
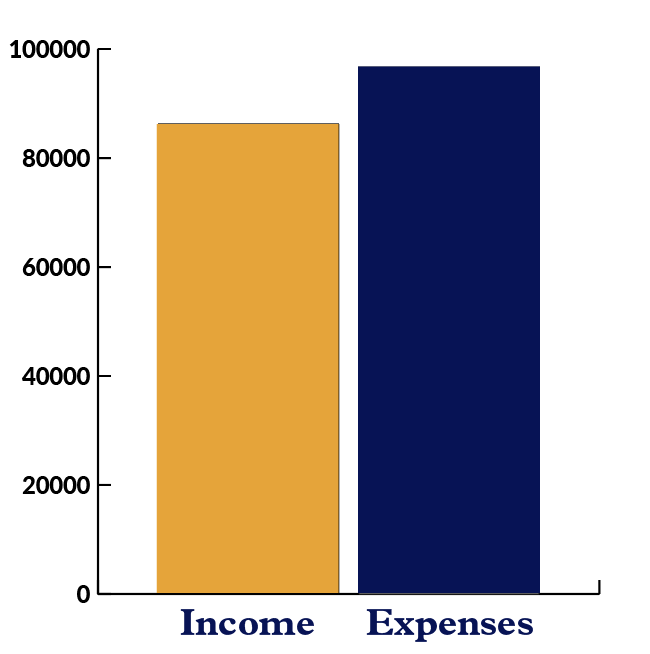
This indicator shows that we can successfully maintain non-grant related operations with the income generated through programs.
In 2020, our self-sufficiency was 125% compared to 110% in 2019.
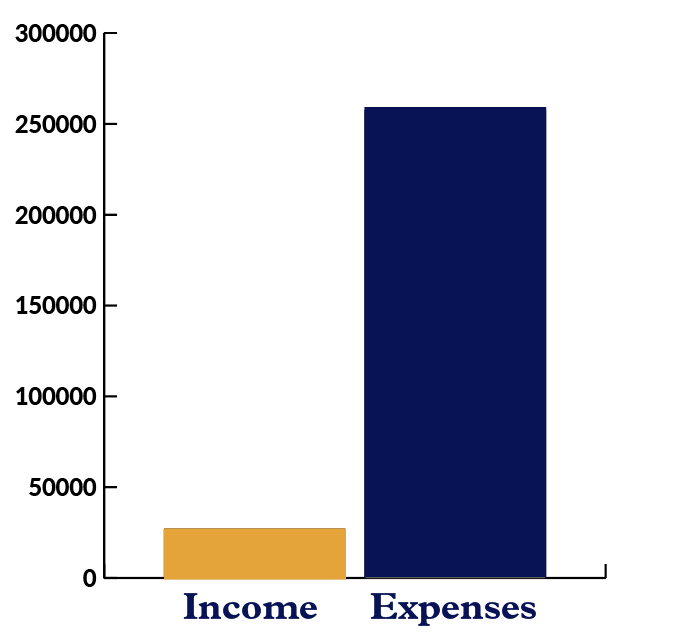
Administrative expenses are associated with activities that support The Carpentries overall and are not associated with a specific program. These activities are necessary to all programs.
In 2020, our overhead ratio was 41% compared to 35% in 2019.
Activities that fulfill The Carpentries mission and directly impact and support our community.
| 2020 | 2019 | |
|---|---|---|
| Curriculum | $2,500 | |
| Donations | $22,100 | $11,004 |
| Instructor Training | $26,900 | $50,050 |
| Workshops | $86,250 | $97,961 |
| Other | $178,316 | |
| Memberships | $638,616 | $957,783 |
| Grants & Sponsorships | $1,191,842 | $1,645,482 |
As of December 31, 2020 our operating balance is $1,617,604. This includes $1,214,585 in grants and sponsorship (restricted funds), $224,702 in unrestricted funds, and $178,317 in reserve.
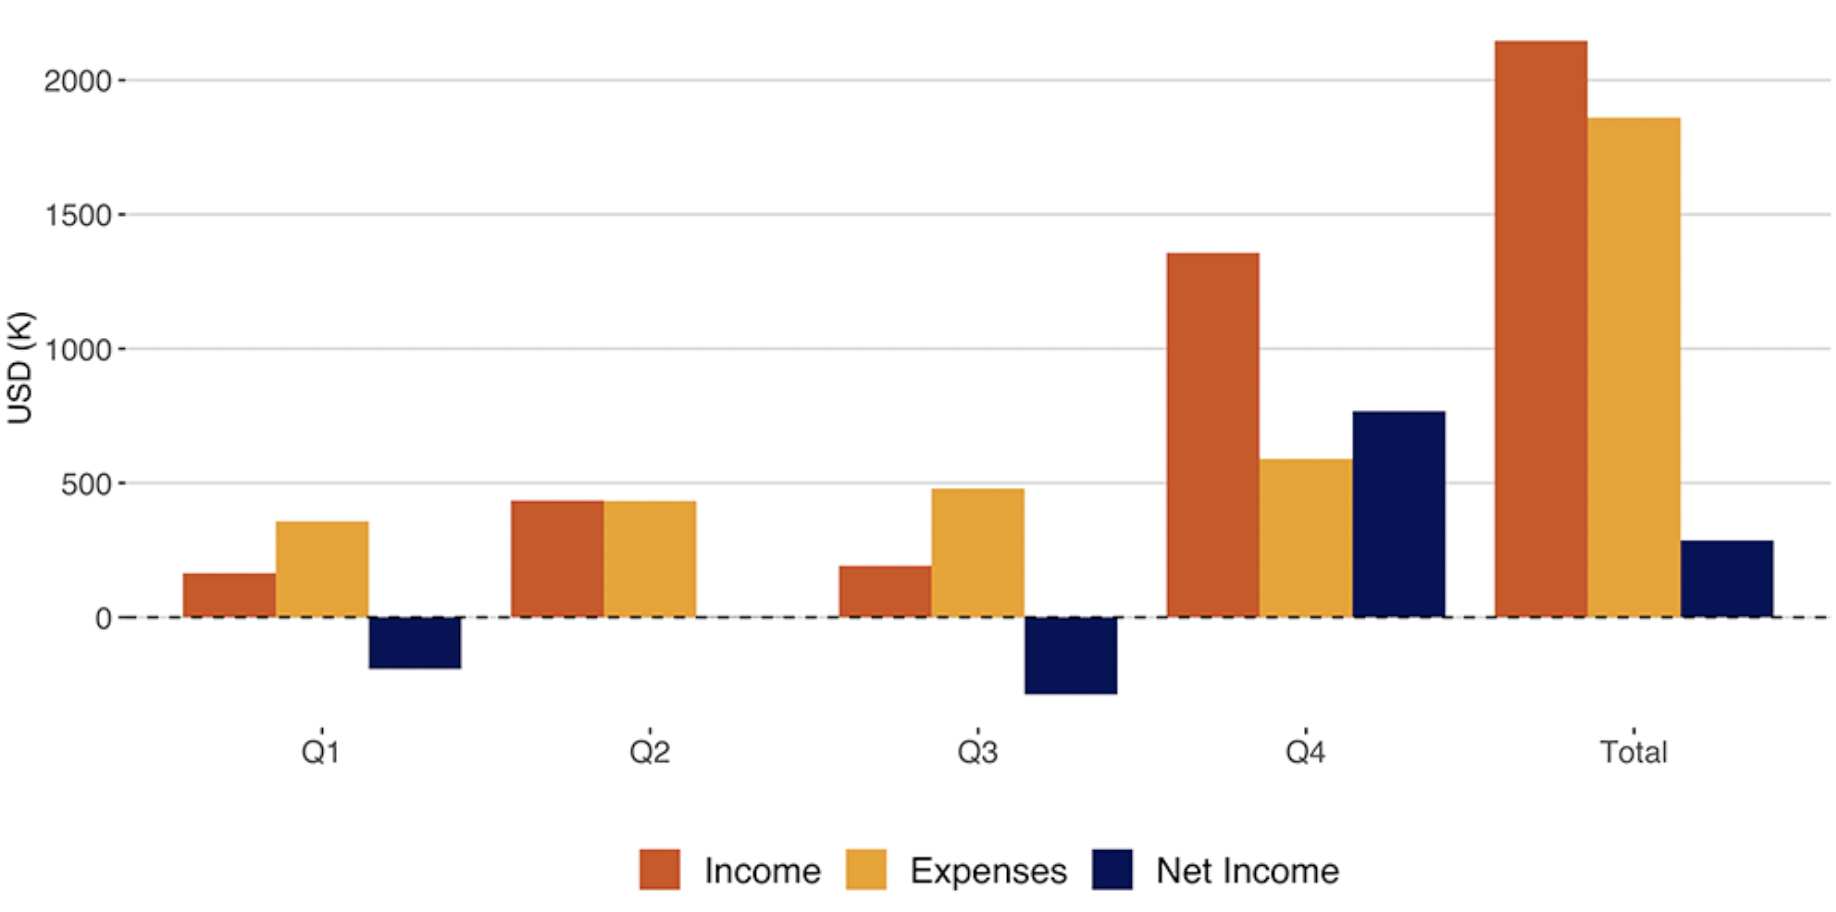
In 2020, we observed a 22% increase in expenses, and a decrease in our overall income as a result of the global Coronavirus pandemic. Our net cash flow (total income minus total expenses) for 2020 was $286,809.
We are primed to continue supporting the work of our community and Core Team in 2021. Revenue generated through grants, programs, donations and sponsorships will support our core operations and community outreach.
Our work to improve and scale our programs is supported by grants from the Chan Zuckerberg Initiative and the Gordon and Betty Moore Foundation. These grants run through 2021 and 2022, respectively, and will help us:
Additionally, we have secured funding from Code for Science & Society’s Event Fund to support CarpentryConnect South Africa in 2021, and will pursue additional grant funding opportunities to address equity, inclusion, accessibility, and assessment of our programs.
In 2020, our fiscal sponsor Community Initiatives was approved to receive funds from the United States’ Paycheck Protection Program (PPP). These loan funds were made available to small businesses to support payroll expenses during the COVID-19 crisis, with the possibility of forgiveness. While we are confident that our application for loan forgiveness will be approved, and we will not be held liable for repaying these funds to the government, we have set aside an amount equal to the PPP funds we received in a reserve account. We will keep these funds in a reserve until our loan forgiveness application is approved.
Our general funds are unrestricted funds available to support any Carpentries related expenses. At the start of 2021, our financial position provided us with unrestricted funds adequate to cover less than two months of operating expenses. This is below our goal of having a minimum of three months operating expenses.
The Carpentries’ vision is to be the leading inclusive community teaching data and coding skills. Through financial support from our members, partners, and community, we are uniquely positioned to pursue long-term financial sustainability.
If you are interested in partnering with The Carpentries, contact us at [team@carpentries.org](mailto:team@carpentries.org).
This financial report for the fiscal year 2020 (January 1, 2020 through December 31, 2020) was created in the interest of transparency, financial planning, and sustainability.
A full collection of financial statements and notes on our accounting practices are provided in the appendix.
Questions? Send inquiries to finance@carpentries.org.